Income, Poverty and Health Insurance
Coverage in the United States: 2019
|
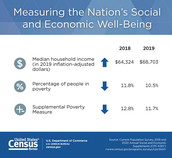
SEPT. 15, 2020 — The U.S. Census Bureau announced today that median household
income in 2019 increased 6.8% from 2018, and the official poverty rate
decreased 1.3 percentage points. Meanwhile the percentage of people with
health insurance coverage for all or part of 2019 was 92.0% and 8.0% of
people, or 26.1 million, did not have health insurance at any point during
2019, according to the 2020 Current Population Survey Annual Social and
Economic Supplement (CPS ASEC).
|
Median household income was
$68,703 in 2019, an increase of 6.8% from the 2018 median. Between 2018 and
2019, the real median earnings of all workers increased by 1.4%, while the real
median earnings of full-time, year-round workers increased 0.8%. The 2019 real
median earnings of men and women who worked full-time, year-round increased by
2.1% and 3.0%, respectively, between 2018 and 2019. The difference between the
2018-2019 percent changes in median earnings for men and women working
full-time, year-round was not statistically significant. The number of
full-time, year-round workers increased by approximately 1.2 million between
2018 and 2019. Between 2018 and 2019, the total number of people with earnings
increased by about 2.2 million.
The official poverty rate in
2019 was 10.5%, a decrease of 1.3 percentage points from 11.8% in 2018. This is
the fifth consecutive annual decline in the national poverty rate. Since 2014,
the poverty rate has fallen 4.3 percentage points, from 14.8% to 10.5%. The
2019 poverty rate of 10.5% is the lowest rate observed since estimates were
initially published for 1959. The number of people in poverty in 2019 was 34.0
million, 4.2 million fewer people than 2018.
Private health insurance
coverage was more prevalent than public coverage, covering 68.0% and 34.1% of
the population at some point during the year, respectively. Employment-based
insurance was the most common subtype. Some people may have more than one
coverage type during the calendar year.
These findings are contained in
two reports: Income and
Poverty in the United States: 2019 and Health Insurance
Coverage in the United States: 2019.
Another Census Bureau report, The Supplemental
Poverty Measure: 2019, was also released today. The Supplemental
Poverty Measure (SPM) rate in 2019 was 11.7%. This was 1.0 percentage point
lower than the 2018 SPM rate of 12.8%. The SPM provides an alternative way of
measuring poverty in the United States and serves as an additional indicator of
economic well-being. The Census Bureau has published poverty estimates using
the SPM annually since 2011 with the collaboration of the U.S. Bureau of Labor
Statistics (BLS).
The Current
Population Survey (CPS), sponsored jointly by the Census Bureau
and BLS,
is conducted every month and is the primary source of labor force statistics
for the U.S. population; it is used to calculate monthly unemployment rate
estimates. Supplements are added in most months; the CPS ASEC is designed to
give annual, national estimates of income, poverty and health insurance numbers
and rates. The CPS ASEC is conducted in February, March and April. It collects
information about income and health insurance coverage during the prior
calendar year. As data were collected in February, March and April 2020 about
income and health insurance coverage in 2019, this report does not reflect
economic impacts related to COVID-19, but instead serves as a pre-pandemic
benchmark for future research.
This year, data collection
faced extraordinary circumstances. As the United States began to grapple with
the implications of the COVID-19 pandemic for the nation, interviewing for the
March CPS began on March 15. In order to protect the health and safety of
Census Bureau staff and respondents, the survey suspended in-person
interviewing and closed both Computer-Assisted Telephone Interviewing (CATI)
contact centers on March 20. For the rest of March and through April, the
Census Bureau continued to attempt all interviews by phone. For those whose
first month in the survey was March or April, the Census Bureau used
vendor-provided telephone numbers associated with the sample address.
While the Census Bureau went to
great lengths to complete interviews by telephone, the response rate for the
CPS basic household survey was 73% in March 2020, about 10 percentage points
lower than in preceding months and the same period in 2019, which were
regularly above 80%. The change from conducting first interviews in person to
making first contacts by telephone contributed to the lower response rates and
it is likely that the characteristics of people for whom a telephone number was
found may be systematically different from the people for whom the Census
Bureau was unable to obtain a telephone number. While the Census Bureau creates weights
designed to adjust for nonresponse and to control weighted counts to
independent population estimates by age, sex, race and Hispanic origin, the
magnitude of the increase in (and differential nature of) nonresponse related
to the pandemic likely reduced their efficacy. Using administrative data,
Census Bureau researchers have documented that the nonrespondents in 2020 are
less similar to respondents than in earlier years. Of particular interest for
the estimates in this report released today are the differences in
median income and educational attainment, indicating that
respondents in 2020 had relatively higher income and were more educated than
nonrespondents.
The 2019 income and poverty
report is based on the CPS ASEC and includes comparisons with the previous year
and historical tables in the report, which contain statistics back to 1959. The
health insurance report is based on both the CPS ASEC and the American
Community Survey (ACS). State and local income, poverty and health insurance
estimates from the ACS will be released Thursday, Sept. 17.
Income
- Median household income was $68,703 in 2019, an
increase of 6.8% from the 2018 median of $64,324.
- The 2019 real median income of family households and
nonfamily households increased 7.3% and 6.2%, respectively, between 2018
and 2019. This is the fifth consecutive annual increase in median
household income for family households and the second consecutive increase
for nonfamily households. The difference between the 2018-2019 percent
changes in median income for family (7.3%) and nonfamily (6.2%) households
was not statistically significant.
- Real median household incomes increased for all regions
in 2019: 6.8% in the Northeast, 4.8% in the Midwest, 6.1% in the South,
and 7.0% in the West. The differences between the 2018-2019 percent
changes in median household income for all regions were not statistically
significant.
Race and Hispanic Origin
(Race data refer to people
reporting a single race only; Hispanics can be of any race.)
- The 2019 real median incomes of White, Black, Asian and
Hispanic households all increased from 2018. The differences between the
2018-2019 percent changes in household median income for each race group
were not statistically significant.
Earnings
- The 2019 real median earnings of men ($57,456) and
women ($47,299) who worked full-time, year-round increased by 2.1% and
3.0%, respectively. The difference between the 2018-2019 percent change in
median earnings for men working full-time, year-round and women working
full-time, year-round was not statistically significant.
- The 2019 female-to-male earnings ratio was 0.823, not
statistically different from the 2018 ratio.
- Between 2018 and 2019, the real median earnings of all
workers and full-time, year-round workers increased 1.4% and 0.8%,
respectively.
- Between 2018 and 2019, the total number of people with
earnings, regardless of work experience, increased by about 2.2 million.
The number of full-time, year-round workers increased by approximately 1.2
million.
Poverty
As defined by the Office of
Management and Budget (OMB) and updated for inflation using the Consumer Price
Index, the weighted average poverty threshold for a family of four in 2019 was
$26,172. (See <www.census.gov/data/tables/time-series/demo/income-poverty/historical-poverty-thresholds.html>
for the complete set of dollar value thresholds that vary by family size and
composition.)
- The official poverty rate in 2019 was 10.5%; down 1.3
percentage points from 11.8% in 2018 (the OMB determined the official
definition of poverty in Statistical Policy Directive 14).
- The 2019 poverty rate of 10.5% marks the fifth
consecutive annual decline in poverty. Since 2014, the poverty rate has
fallen 4.3 percentage points, from 14.8% to 10.5%.
- The 2019 poverty rate of 10.5% is the lowest rate
observed since estimates were initially published for 1959.
- In 2019, there were 34.0 million people in poverty,
approximately 4.2 million fewer people than 2018.
Race and Hispanic Origin
(Race data refer to people
reporting a single race only; Hispanics can be of any race.)
- Between 2018 and 2019, poverty rates declined for all
major race and Hispanic origin groups.
- The poverty rate for Whites decreased 1.0 percentage
point to 9.1%. The poverty rate for Blacks decreased by 2.0 percentage
points to 18.8%. The poverty rate for Asians decreased 2.8 percentage
points to 7.3%. The poverty rate for Hispanics decreased by 1.8 percentage
points to 15.7%.
- The percentage point change in poverty rates from 2018
to 2019 for Blacks is not significantly different than the percentage
point change for Whites, Asians or Hispanics. The percentage point change
from 2018 to 2019 for Hispanics is not significantly different from the
percentage point change for Asians.
Age
- Between 2018 and 2019, poverty rates for children under
the age of 18 decreased 1.8 percentage points, from 16.2% to 4%.
- Poverty rates decreased 1.2 percentage points for
adults ages 18 to 64, from 10.7% to 9.4%.
- The poverty rate for people age 65 and older decreased
by 0.9 percentage points, from 7% to 8.9%.
Supplemental Poverty Measure
The SPM extends the official
poverty measure by taking into account many of the government programs designed
to assist low-income families and individuals that are not included in the
current official poverty measure.
- The SPM released today shows: in 2019, the overall SPM
rate was 11.7%. This was 1.0 percentage point lower than the 2018 SPM rate
of 12.8%.
- The SPM rate for 2019 was 1.3 percentage points higher
than the official poverty rate of 10.5%.
- There were 16 states plus the District of Columbia for
which SPM rates were higher than official poverty rates, 25 states with
lower rates, and 9 states for which the differences were not statistically
significant.
- Social Security continued to be the most important
anti-poverty program, moving 26.5 million individuals out of poverty in
2019. Refundable tax credits moved 7.5 million people out of poverty.
Age
- SPM rates were down for all major age categories:
children under age 18, adults ages 18 to 64, and adults age 65 and older
between 2018 and 2019.
While the official poverty
measure includes only pretax money income, the SPM adds the value of in-kind
benefits, such as the Supplemental Nutrition Assistance Program, school
lunches, housing assistance and refundable tax credits.
Additionally, the SPM deducts
necessary expenses for critical goods and services from income. Expenses that
are deducted include taxes, child care, commuting expenses, contributions
toward the cost of medical care and health insurance premiums, and child
support paid to another household. The SPM permits the examination of the
effects of government transfers on poverty estimates. For example, not
including refundable tax credits (the Earned Income Tax Credit and the
refundable portion of the child tax credit) in resources, the poverty rate for
all people would have been 14.0% rather than 11.7%. The SPM does not replace
the official poverty measure and is not used to determine eligibility for
government programs.
Health Insurance
As in the past several years,
the Census Bureau is releasing estimates of health insurance from two surveys.
The Current Population Survey Annual Social and Economic Supplement (CPS ASEC)
asks people about coverage during the entire previous calendar year. The
American Community Survey (ACS) asks people to report their health insurance
coverage at the time of interview. The use of both surveys provides a more
complete picture of health insurance coverage in the United States in 2019. Highlights
reporting coverage in 2019 come from the CPS ASEC. Highlights reporting change
in health coverage from 2018 to 2019 or health coverage at the state-level come
from the ACS.
- In 2019, 8.0% of people, or 26.1 million, did not have
health insurance at any point during the year, according to the CPS ASEC.
The percentage of people with
health insurance coverage for all or part of 2019 was 92.0%.
- In 2019, 9.2% of people, or 29.6 million, were not
covered by health insurance at the time of interview, according to the
ACS, up from 8.9% and 28.6 million in 2018.
- In 2019, the percentage of people with
employer-provided coverage at the time of interview was slightly higher
than in 2018, from 55.2% in 2018 to 55.4% in 2019.
- The percentage of people with Medicaid coverage at the
time of interview decreased to 19.8% in 2019, down from 20.5% in 2018.
- Between 2018 and 2019, the percentage of people without
health insurance coverage decreased in one state and increased in nineteen
states.
- All states and the District of Columbia had a lower
uninsured rate in 2019 than in 2010.
Regional trends are available
for income, poverty, SPM and health insurance in each respective report, as
well as tables showing state-level coverage for health insurance and poverty
rates using the supplemental poverty measure.
State and Local Estimates From the American Community Survey
Some state-level health
insurance data from the ACS are included in this release. On Thursday, Sept.
17, the Census Bureau will release 2019 single-year estimates of median
household income, poverty and health insurance for all states, counties, places
and other geographic units with populations of 65,000 or more from the ACS.
These statistics will include numerous social, economic and housing
characteristics, such as language, education, commuting, employment, mortgage
status and rent. Subscribers will be able to access these estimates on an embargoed
basis.
The ACS provides a wide range
of important statistics about people and housing for every community (i.e.,
census tracts or neighborhoods) across the nation. The results are used by
everyone from town and city planners to retailers and homebuilders. The survey
is the only source of local estimates for most of the 40 topics it covers.
The CPS ASEC and ACS are subject to sampling and nonsampling
errors. All comparisons made here and in each respective report have been
tested and found to be statistically significant at the 90% confidence level,
unless otherwise noted.
For additional information on the source of the data and accuracy of the
income, poverty and health insurance estimates, visit <https://www2.census.gov/library/publications/2019/demo/iphi-sa.pdf>.
